Research Smarter,
Not Harder.
One platform, built end-to-end for quantitative research. Design your survey, collect responses, run your analysis, and export submission-ready reports — all in one place.
Everything You Need
The Full Research Pipeline,
One Platform.
Seven tools, one workflow — each built for a specific stage of your research. Nothing missing. Nothing extra.
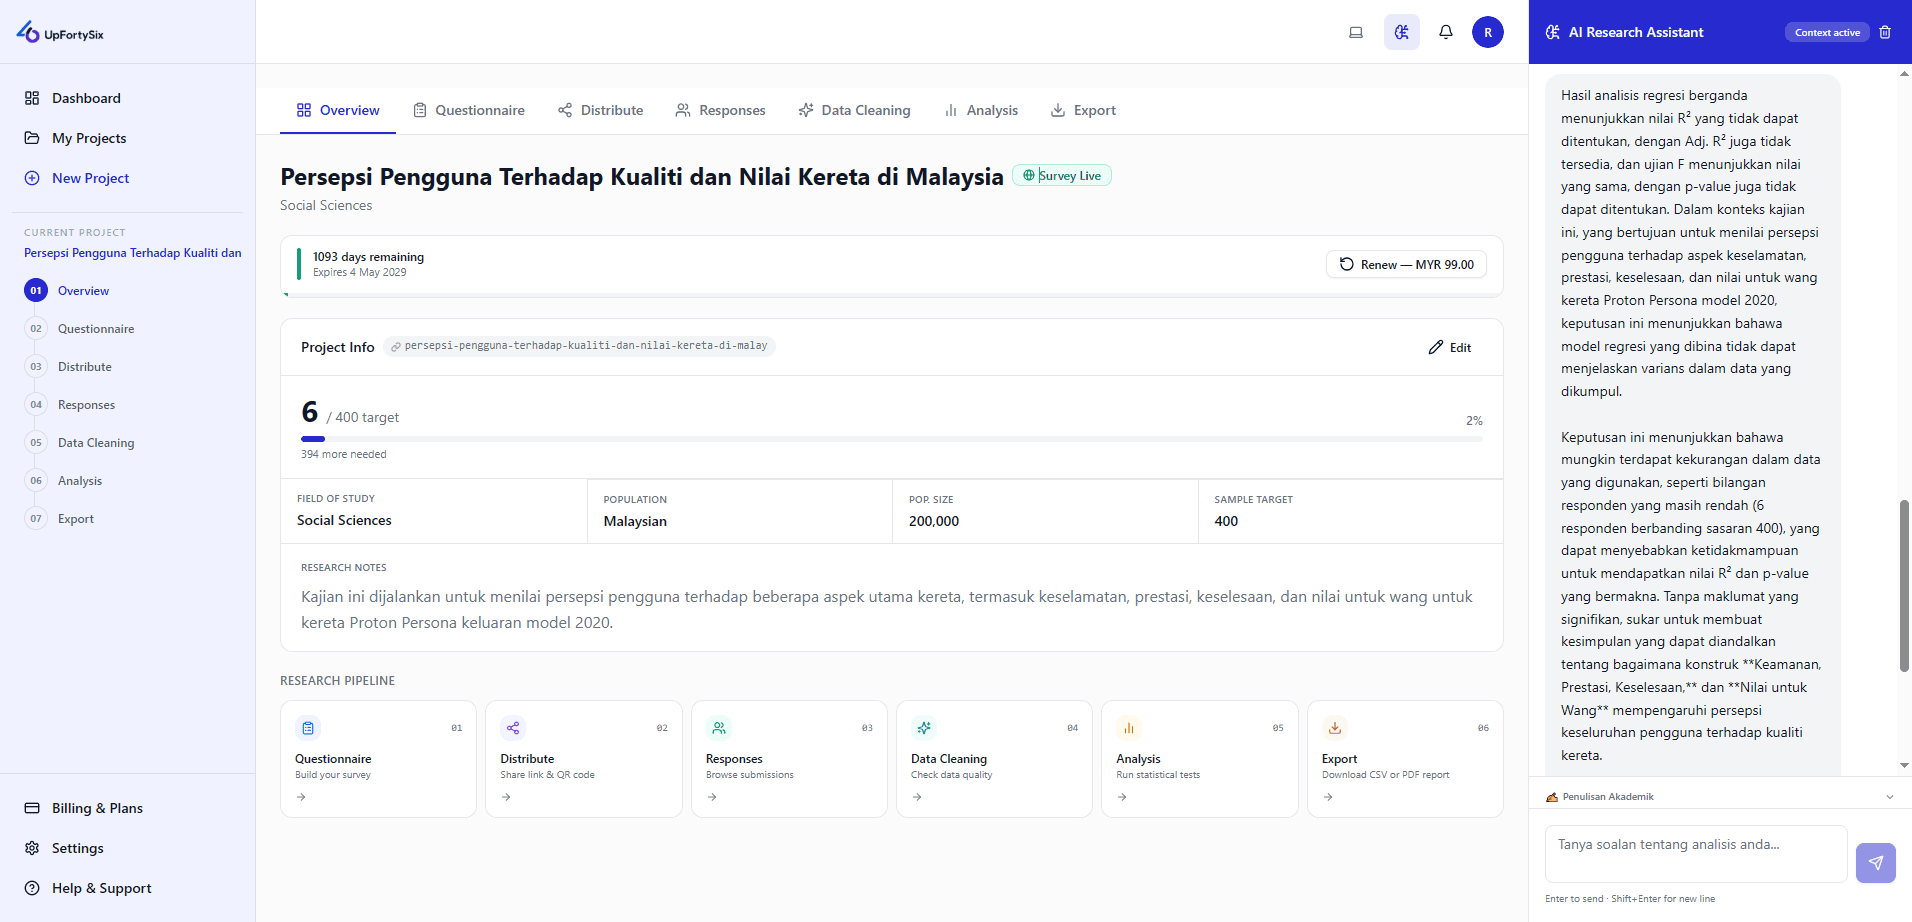
Know Your Target Before You Begin
Submit your questionnaire with confidence — not guesswork. Enter your population size, confidence level, and margin of error, and get the minimum sample size your study needs to be statistically valid.
- Based on the Cochran formula — standard for academic research
- Adjustable confidence level (90%, 95%, 99%) and margin of error
- Instant result — know your target before building the survey
- Helps justify your methodology in your research proposal
Research Setup
Sample Size Calculator
Recommended Sample Size
370
Based on
Cochran formula
Collect at least 370 responses for a statistically valid study at 95% confidence.
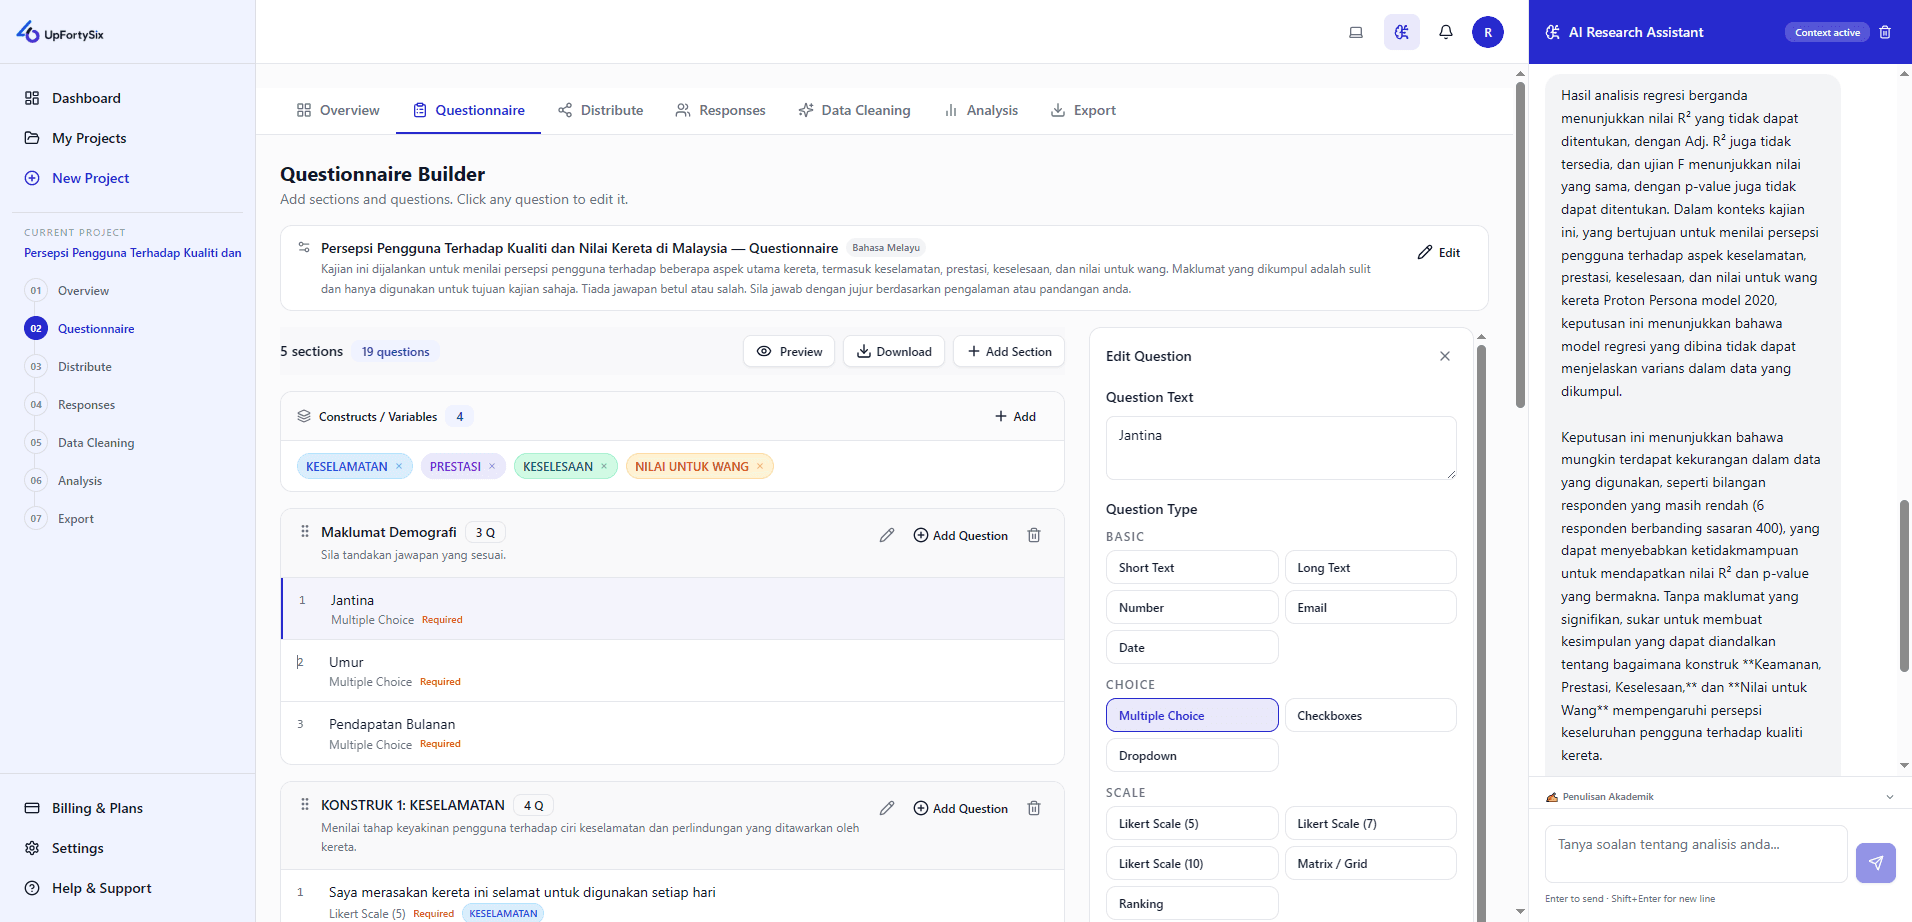
Design Your Questionnaire the Way You Think
Arrange sections and questions exactly as your research framework requires. Group items into constructs for reliability analysis, add conditional skip logic, and preview the live survey before publishing — all without writing code.
- 14 question types — Likert 5/7/10, matrix, ranking, open-ended, and more
- Drag-and-drop reordering for sections and questions
- Construct grouping for Cronbach's Alpha reliability analysis
- Per-question skip logic based on respondent answers
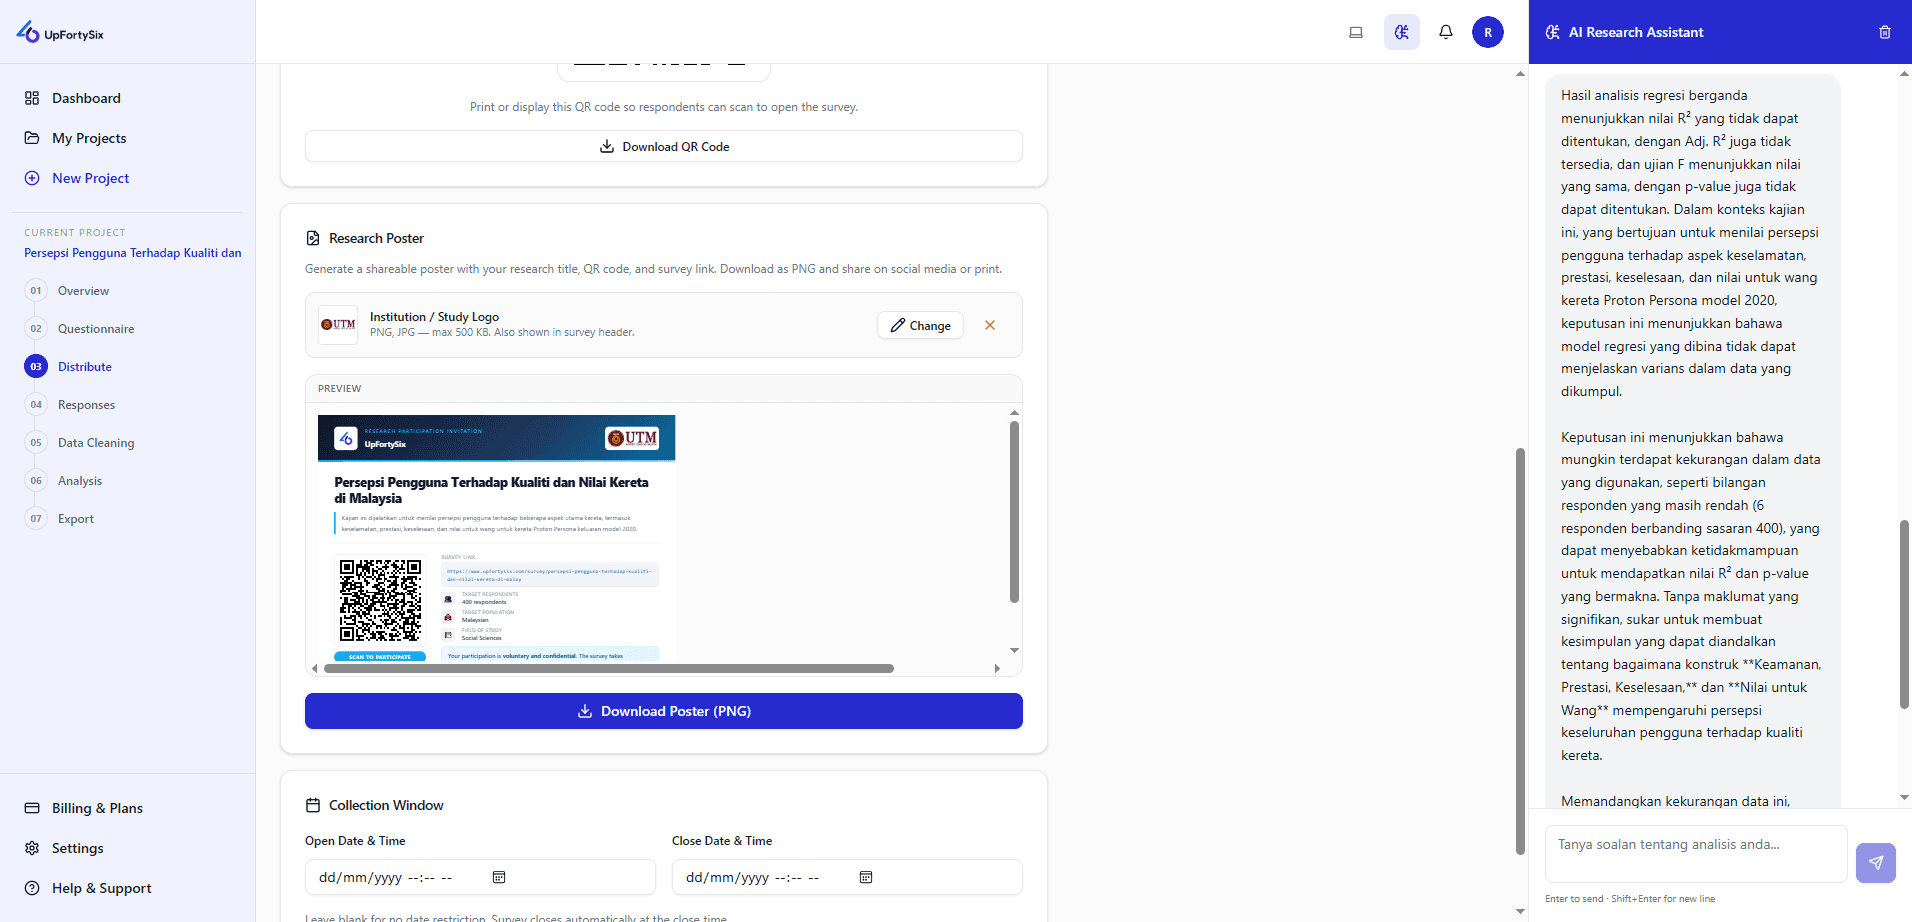
Reach Respondents Through Every Channel
Once your survey is published, sharing it takes seconds. Generate a public link, a custom URL slug, a downloadable QR code, or a print-ready research poster — all from the same dashboard page.
- Custom survey URL slug for clean, professional-looking links
- One-click QR code download — paste into slides or print
- Research poster generator with your logo, QR, and project details
- Open / close date scheduling with automatic enforcement
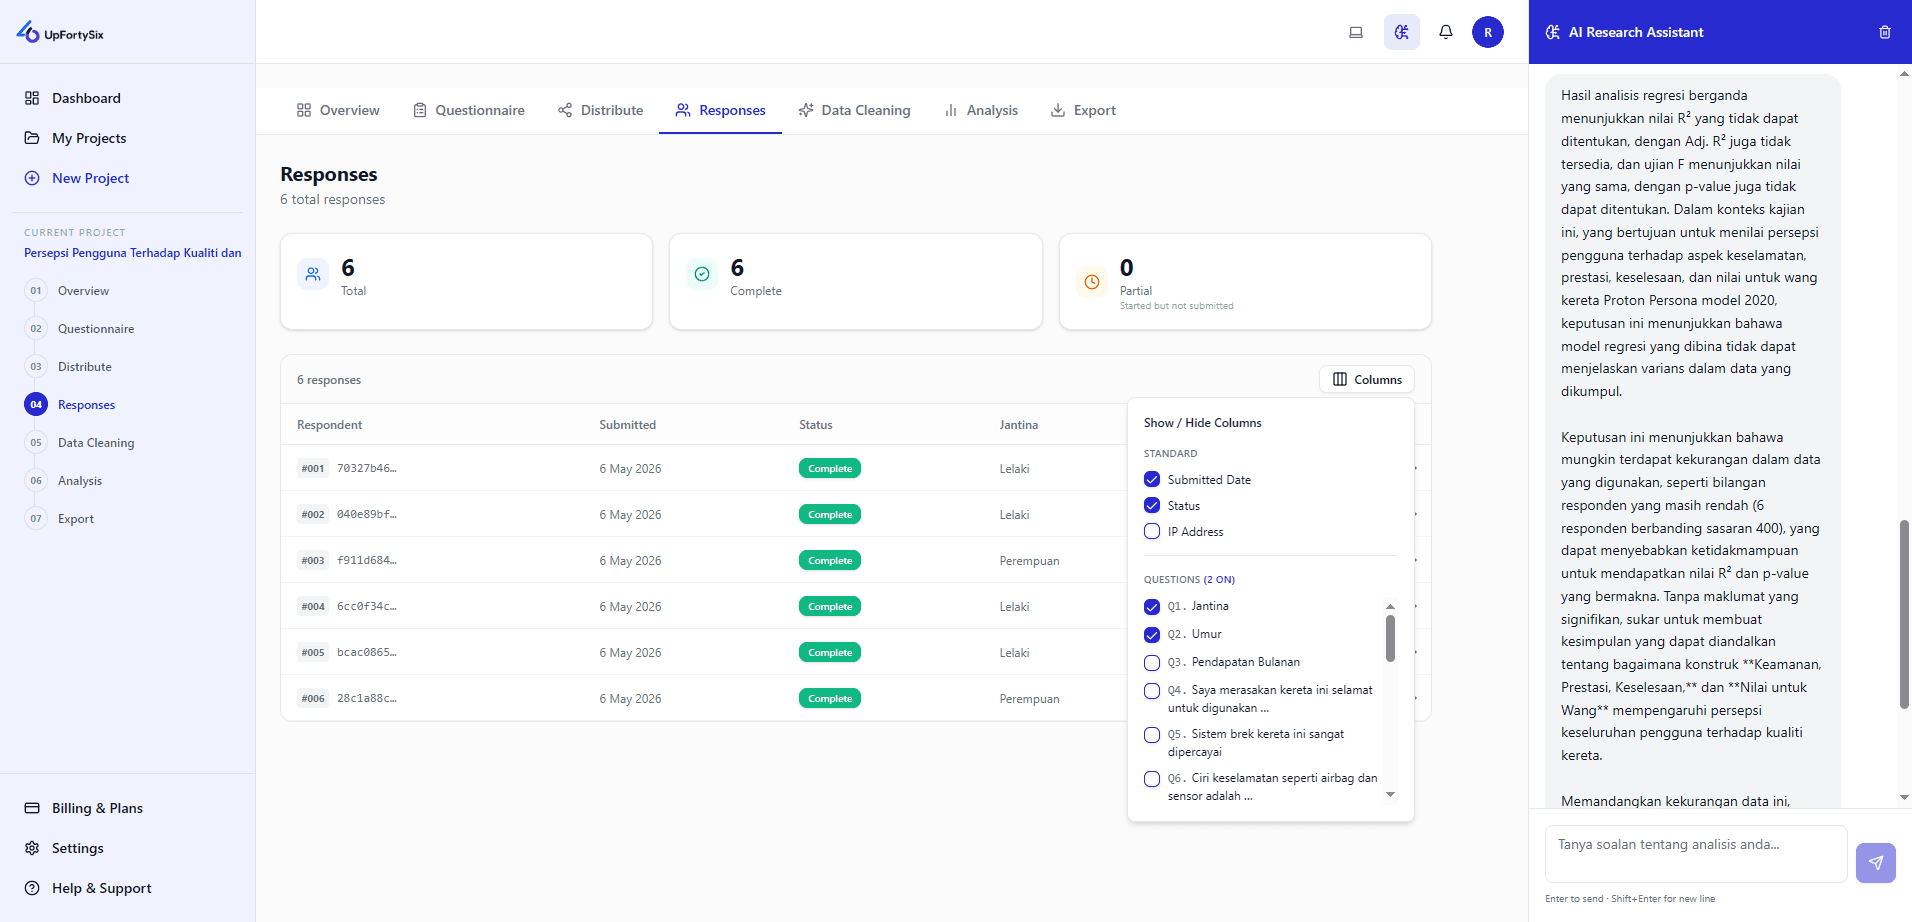
Collect Unlimited Responses, No Account Needed
Respondents click a link or scan a QR — no account, no app, no friction. Every submission is logged, timestamped, and tied to your questionnaire automatically. Monitor completion in real time.
- Anonymous submission — respondents need no account
- Unlimited responses included in every project
- Real-time completion rate and response count tracking
- Duplicate IP detection to protect data integrity
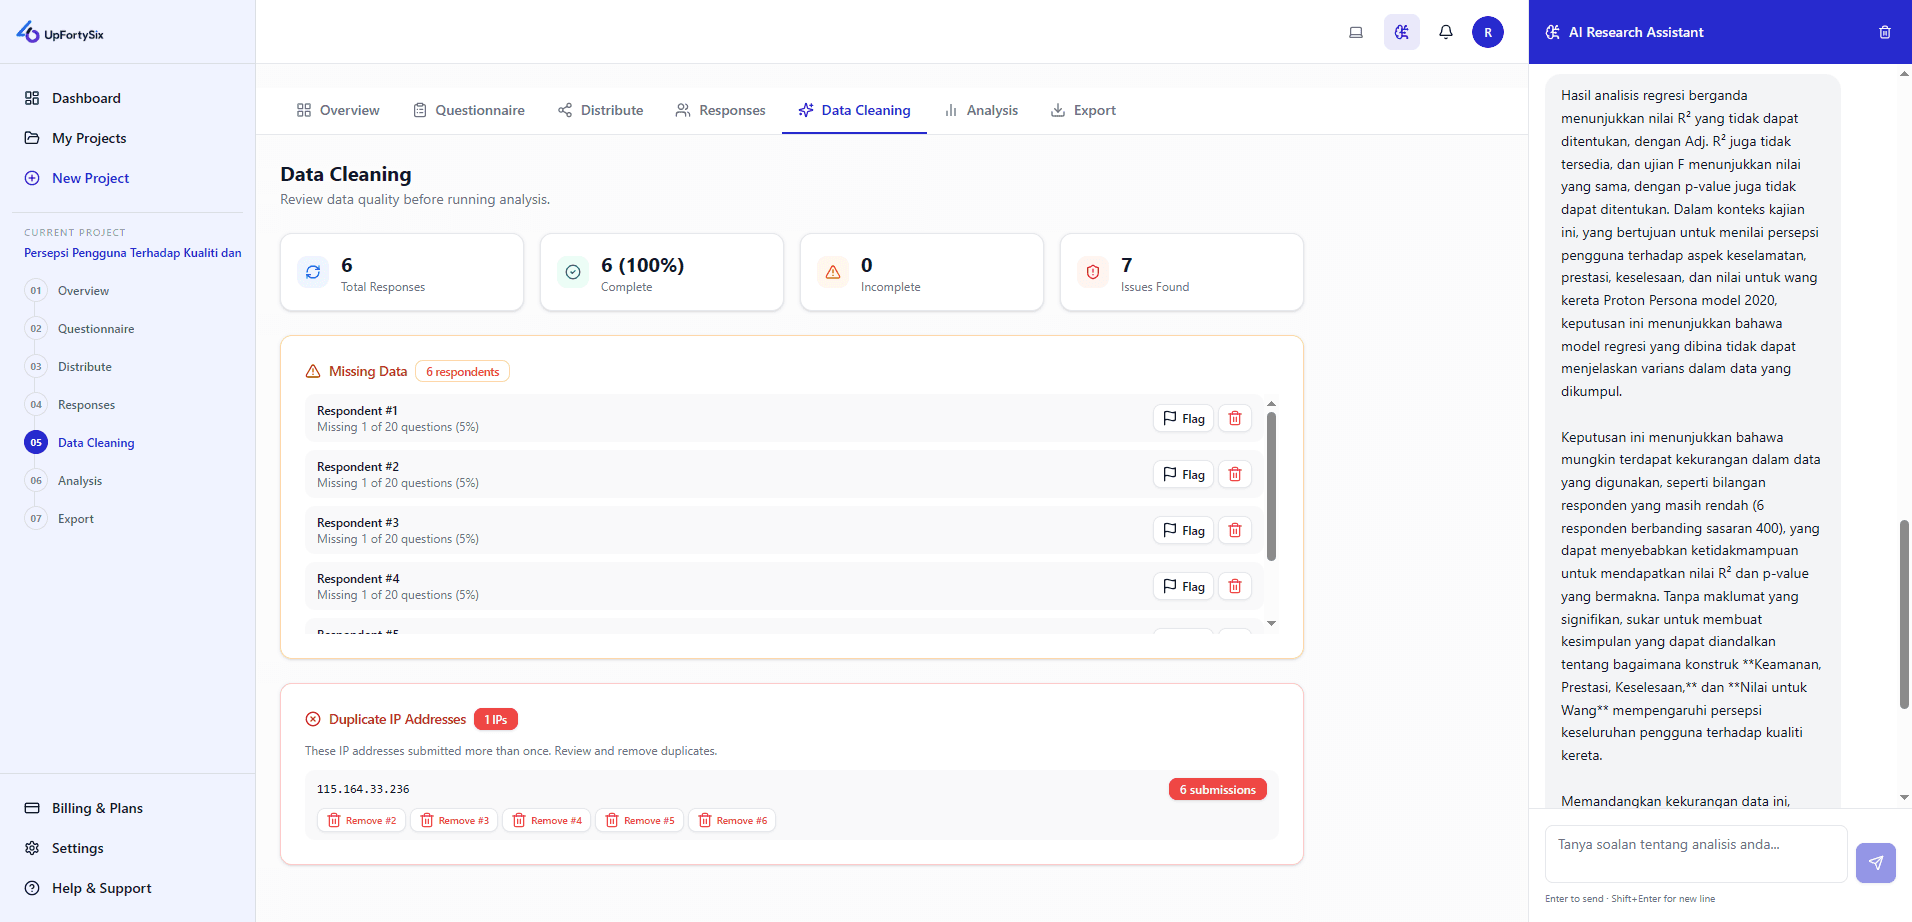
Clean Data Means Trustworthy Results
Before you analyse, your data needs to be right. UpFortySix automatically surfaces missing values, incomplete submissions, and duplicate entries. Any manual edit you make is logged with a reason and timestamp — an audit trail your supervisor can trust.
- Auto-detect missing values and incomplete responses
- Flag duplicate IP addresses and suspicious entries
- Edit individual answers with a full audit log
- Flag or remove respondents without losing original data
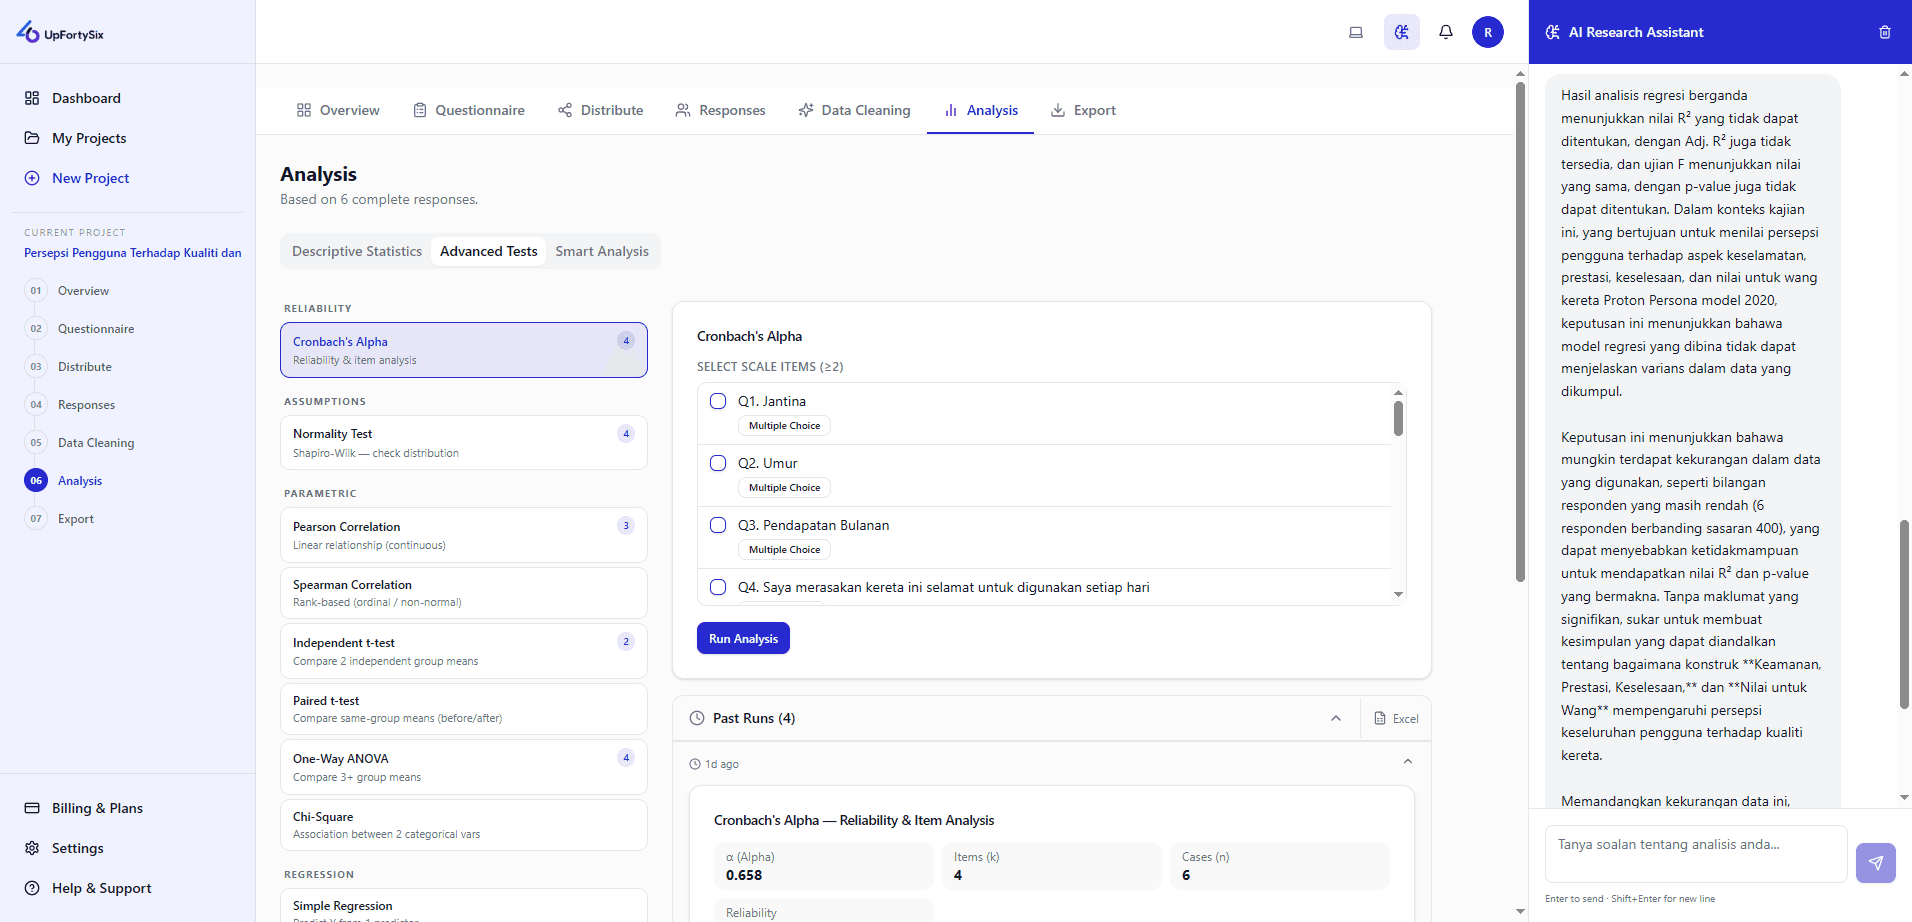
Run the Right Tests. Understand What They Mean.
Smart Analysis reads your data structure and recommends the statistically appropriate tests — so you spend time on insights, not on figuring out which test to use. Every result is saved, exportable, and can be interpreted by AI in academic language.
- Reliability: Cronbach's Alpha with item-total correlation
- Normality, Pearson & Spearman correlation, independent & paired t-tests
- ANOVA, Mann-Whitney U, Kruskal-Wallis, chi-square
- Simple & multiple regression, exploratory factor analysis
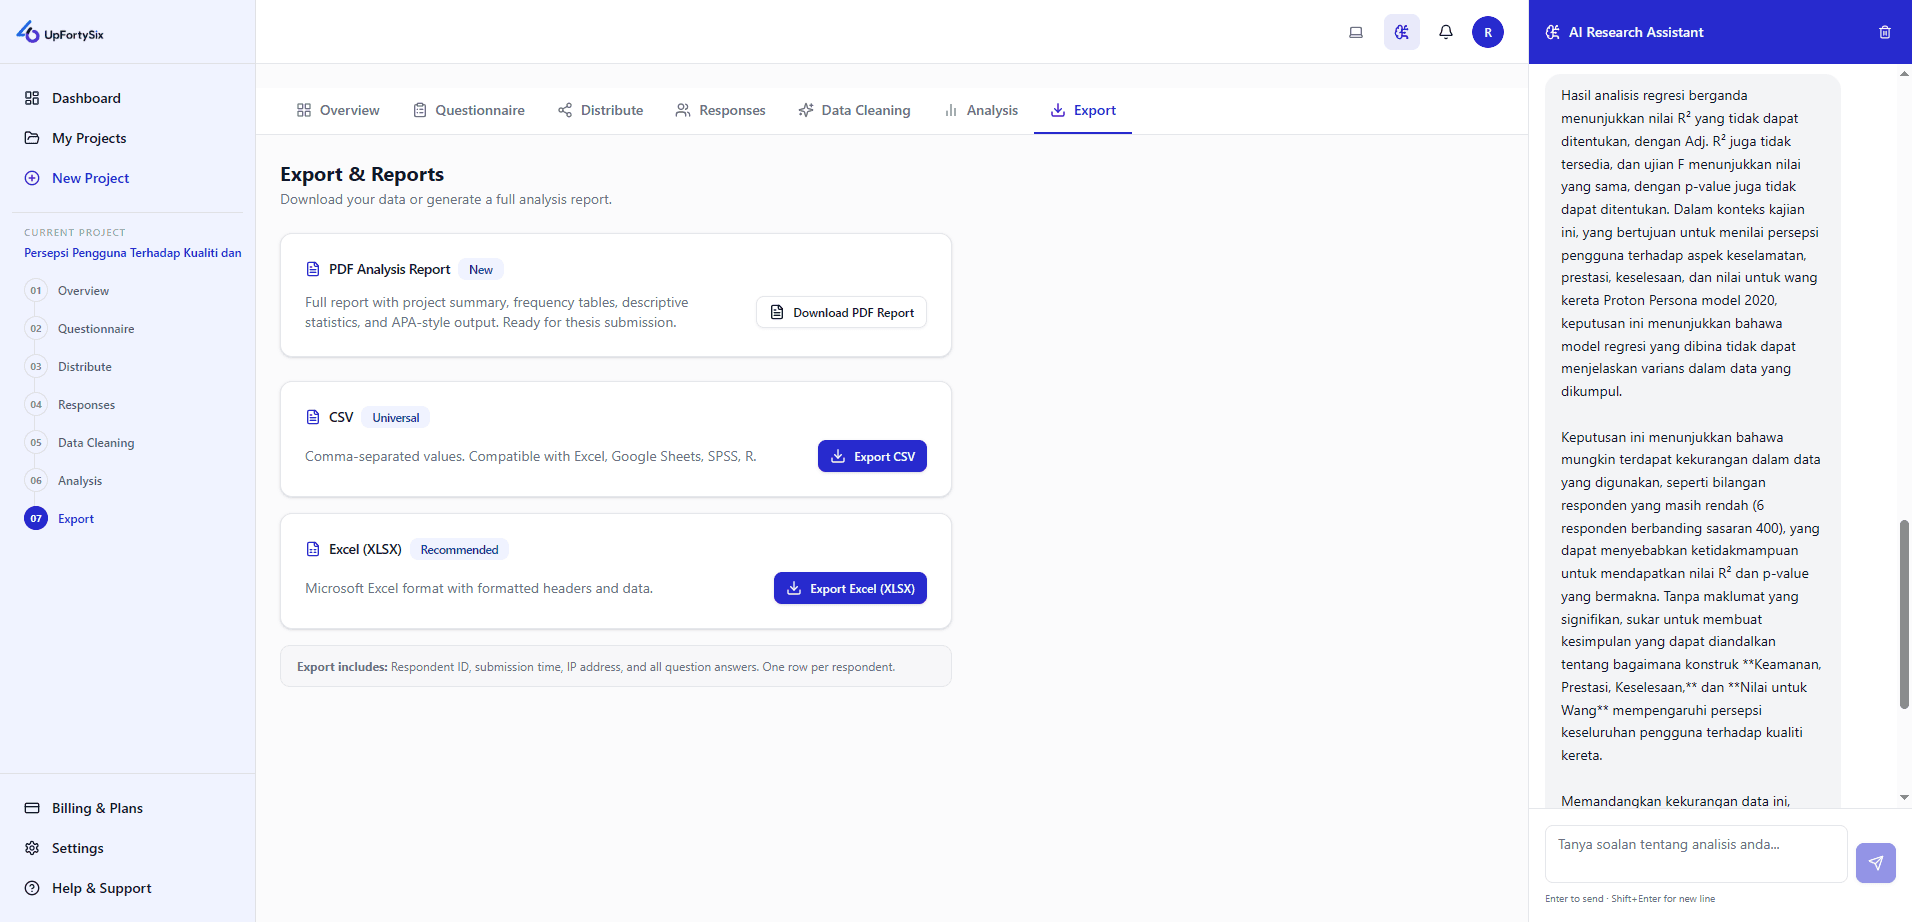
Deliver Submission-Ready Output in One Click
Every result, table, and chart is exportable in the format your supervisor or journal expects. PDF reports include written interpretation summaries. Excel exports preserve full data structure. Download individual stat cards as PNG for presentations.
- PDF report with charts, tables, and AI-written interpretation
- Excel workbook with structured data and full analysis results
- CSV export for compatibility with any other tool
- PNG image download per stat card — ready for slides
How It Works
From Zero to Research Report
in 5 Steps.
The entire quantitative research workflow — survey to report — inside one platform.
Register & Activate a Project
Sign up free. Pay once per project — no subscription, no recurring fees. Each project comes with a 12-month licence.
Build Your Questionnaire
Drag and drop sections, add Likert scales, matrix questions, and skip logic. Preview the live survey before publishing.
Share & Collect Responses
Share a public link, QR code, or custom slug. Respondents answer anonymously on any device. Set open and close dates.
Clean & Analyse
Flag outliers, fix missing values, then run Smart Analysis — it recommends the right statistical tests for your data.
Export & Submit
Download PDF reports, Excel tables, and PNG chart images — formatted and ready for your thesis or academic paper.
Pricing
Per Project. No Subscription.
Register for free. Pay once per project when you're ready to activate — each licence covers 12 months of full access.
Per Project
one-time · 12-month licence
Everything you need to run a complete quantitative research project — from survey to submission.
- 1 active research project
- Unlimited responses
- All 14 question types (Likert, matrix, ranking…)
- Descriptive statistics & Cronbach's Alpha
- Correlation, t-test, ANOVA & regression
- Export CSV / Excel / PDF reports
- AI-assisted result interpretation
- 12-month data retention
Institution
tailored for universities & departments
Manage multiple researchers under one licence. Perfect for universities, faculties, and research departments.
- Unlimited projects
- Lecturer admin dashboard
- Student account management
- Batch analysis across projects
- White-label options
- Dedicated onboarding support
- SLA agreement
- API access